// Data visualization

Baltimore Neighborhood Quality of Life

A quality-of-life score for every Baltimore neighborhood, built from six measures of connectedness and disconnectedness.

Role
Solo project: analysis, visualization, and design
Timeline
2019 · Graduate coursework, MICA (Data Analytics & Visualization)
Tools
R, Excel, Tableau, Illustrator
Team
Solo
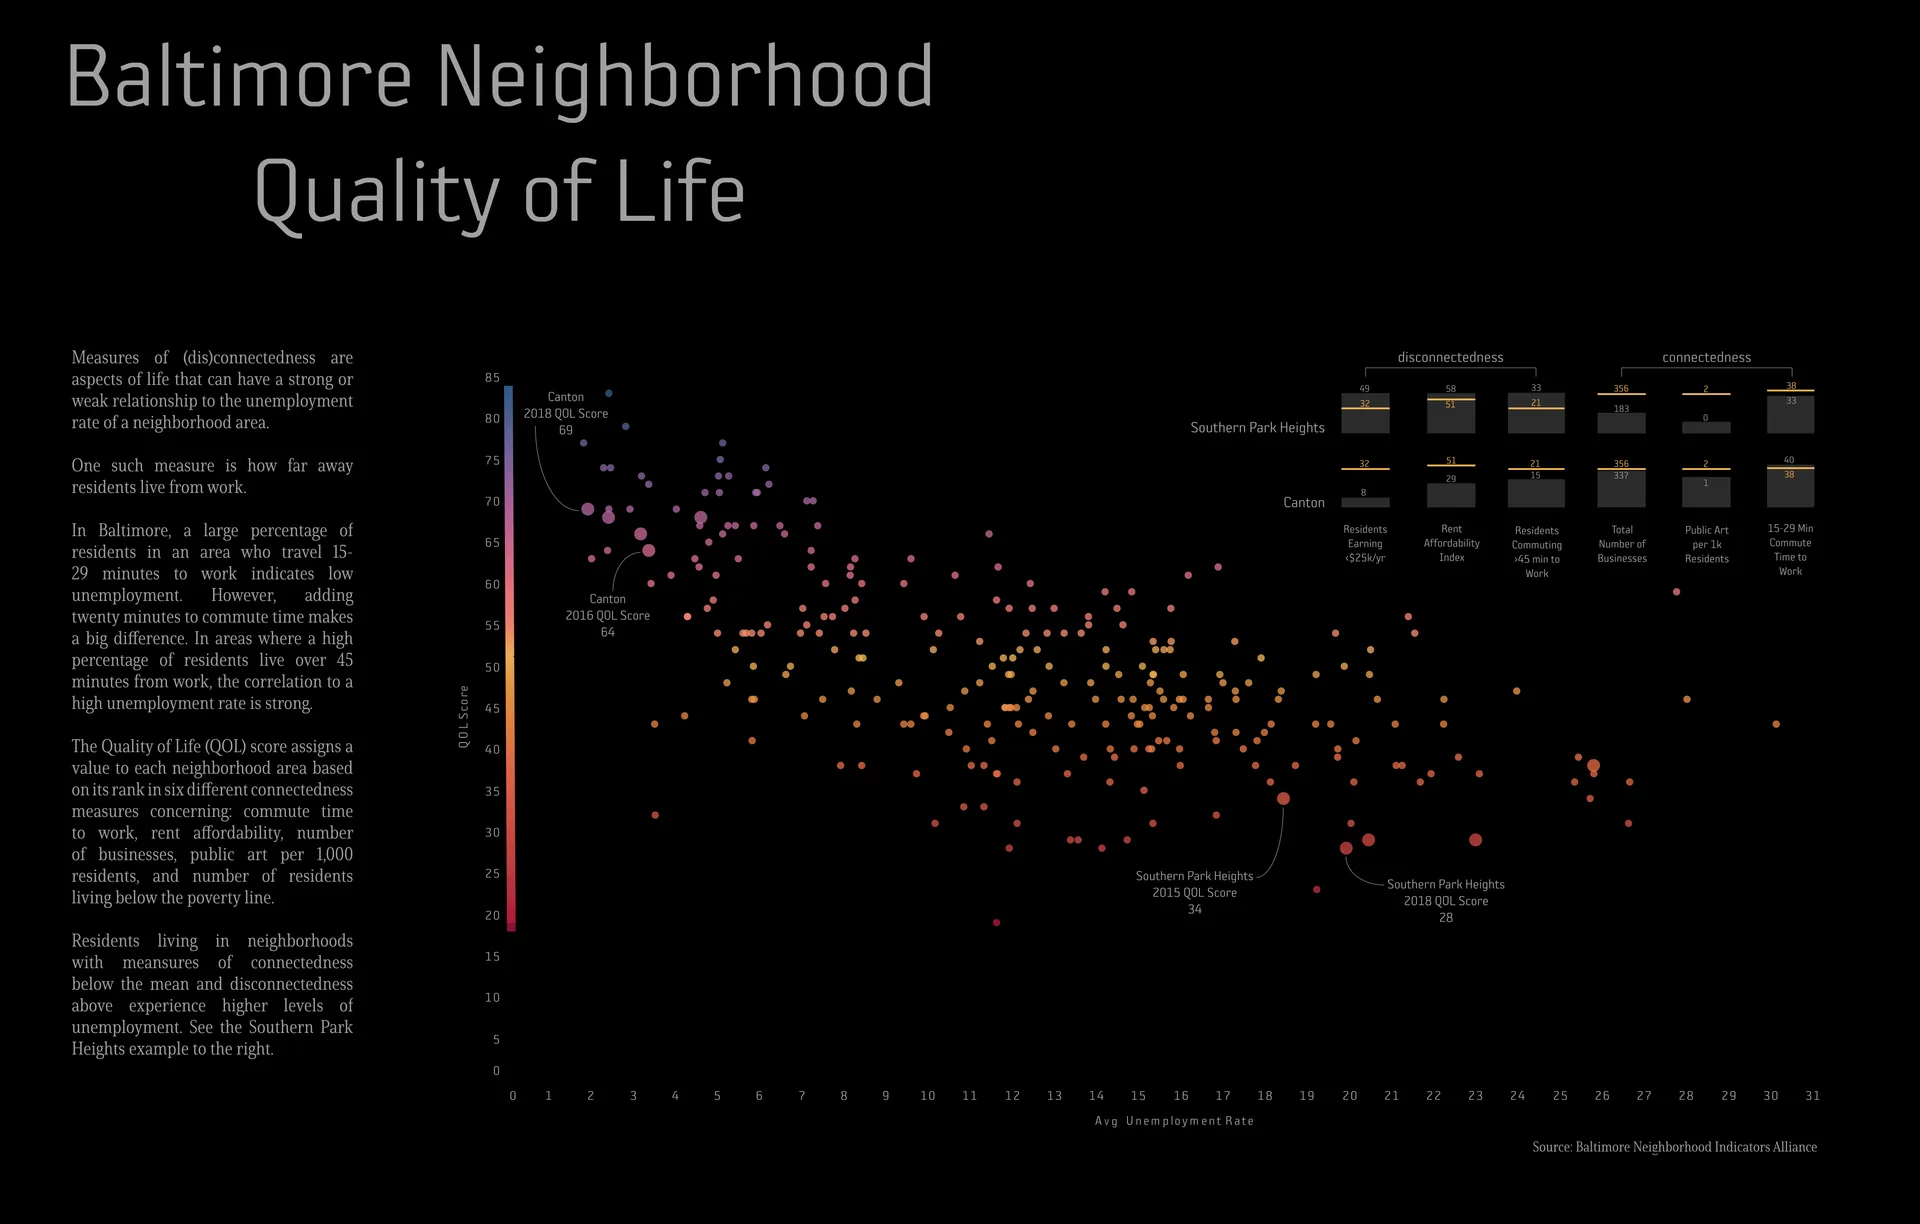
A dark poster titled 'Baltimore Neighborhood Quality of Life.' A scatterplot plots each neighborhood's quality-of-life score (0 to 85) against its average unemployment rate (0 to 31 percent); dots shift from purple at high scores to red at low scores, and scores fall as unemployment rises. Callouts mark Canton (2016 score 64, 2018 score 60) and Southern Park Heights (2015 score 34, 2018 score 28). Small bar charts at top right compare the two neighborhoods on six measures, and a text column on the left explains the score.(opens full size)

Overview and objective

Have you ever wondered how different parts of a neighborhood shape the quality of life of the people who live there? For this project, I used neighborhood data from the Baltimore Neighborhood Indicators Alliance (BNIA) to build a quality-of-life (QOL) score.

The score gives each neighborhood a value based on its rank in six measures of connectedness: two measures of commute time to work, rent affordability, number of businesses, public art per 1,000 residents, and the share of residents earning less than $25,000 a year. The resulting visual gives the city council and administration evidence to argue for business and art development dollars in underserved parts of the city.

Exploration and iteration

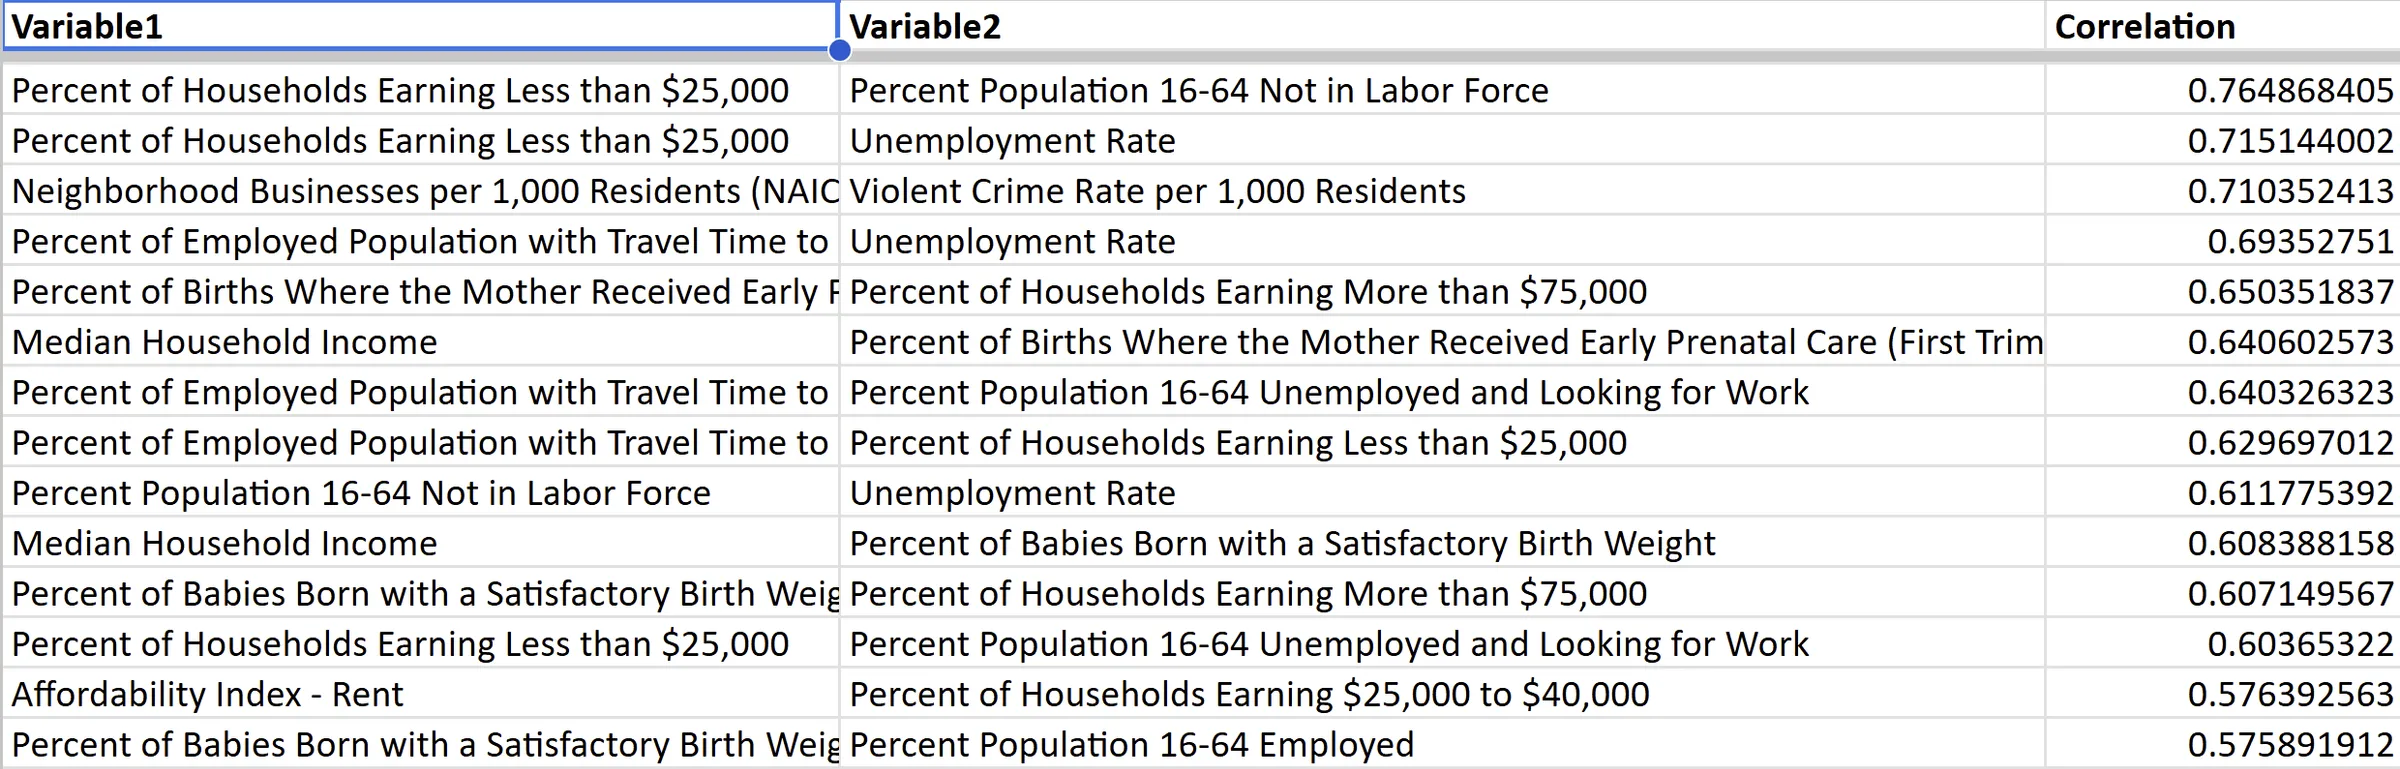
I started by looking for correlations among all of the neighborhood indicators in the BNIA data. I calculated them in R and reviewed the results in Excel.
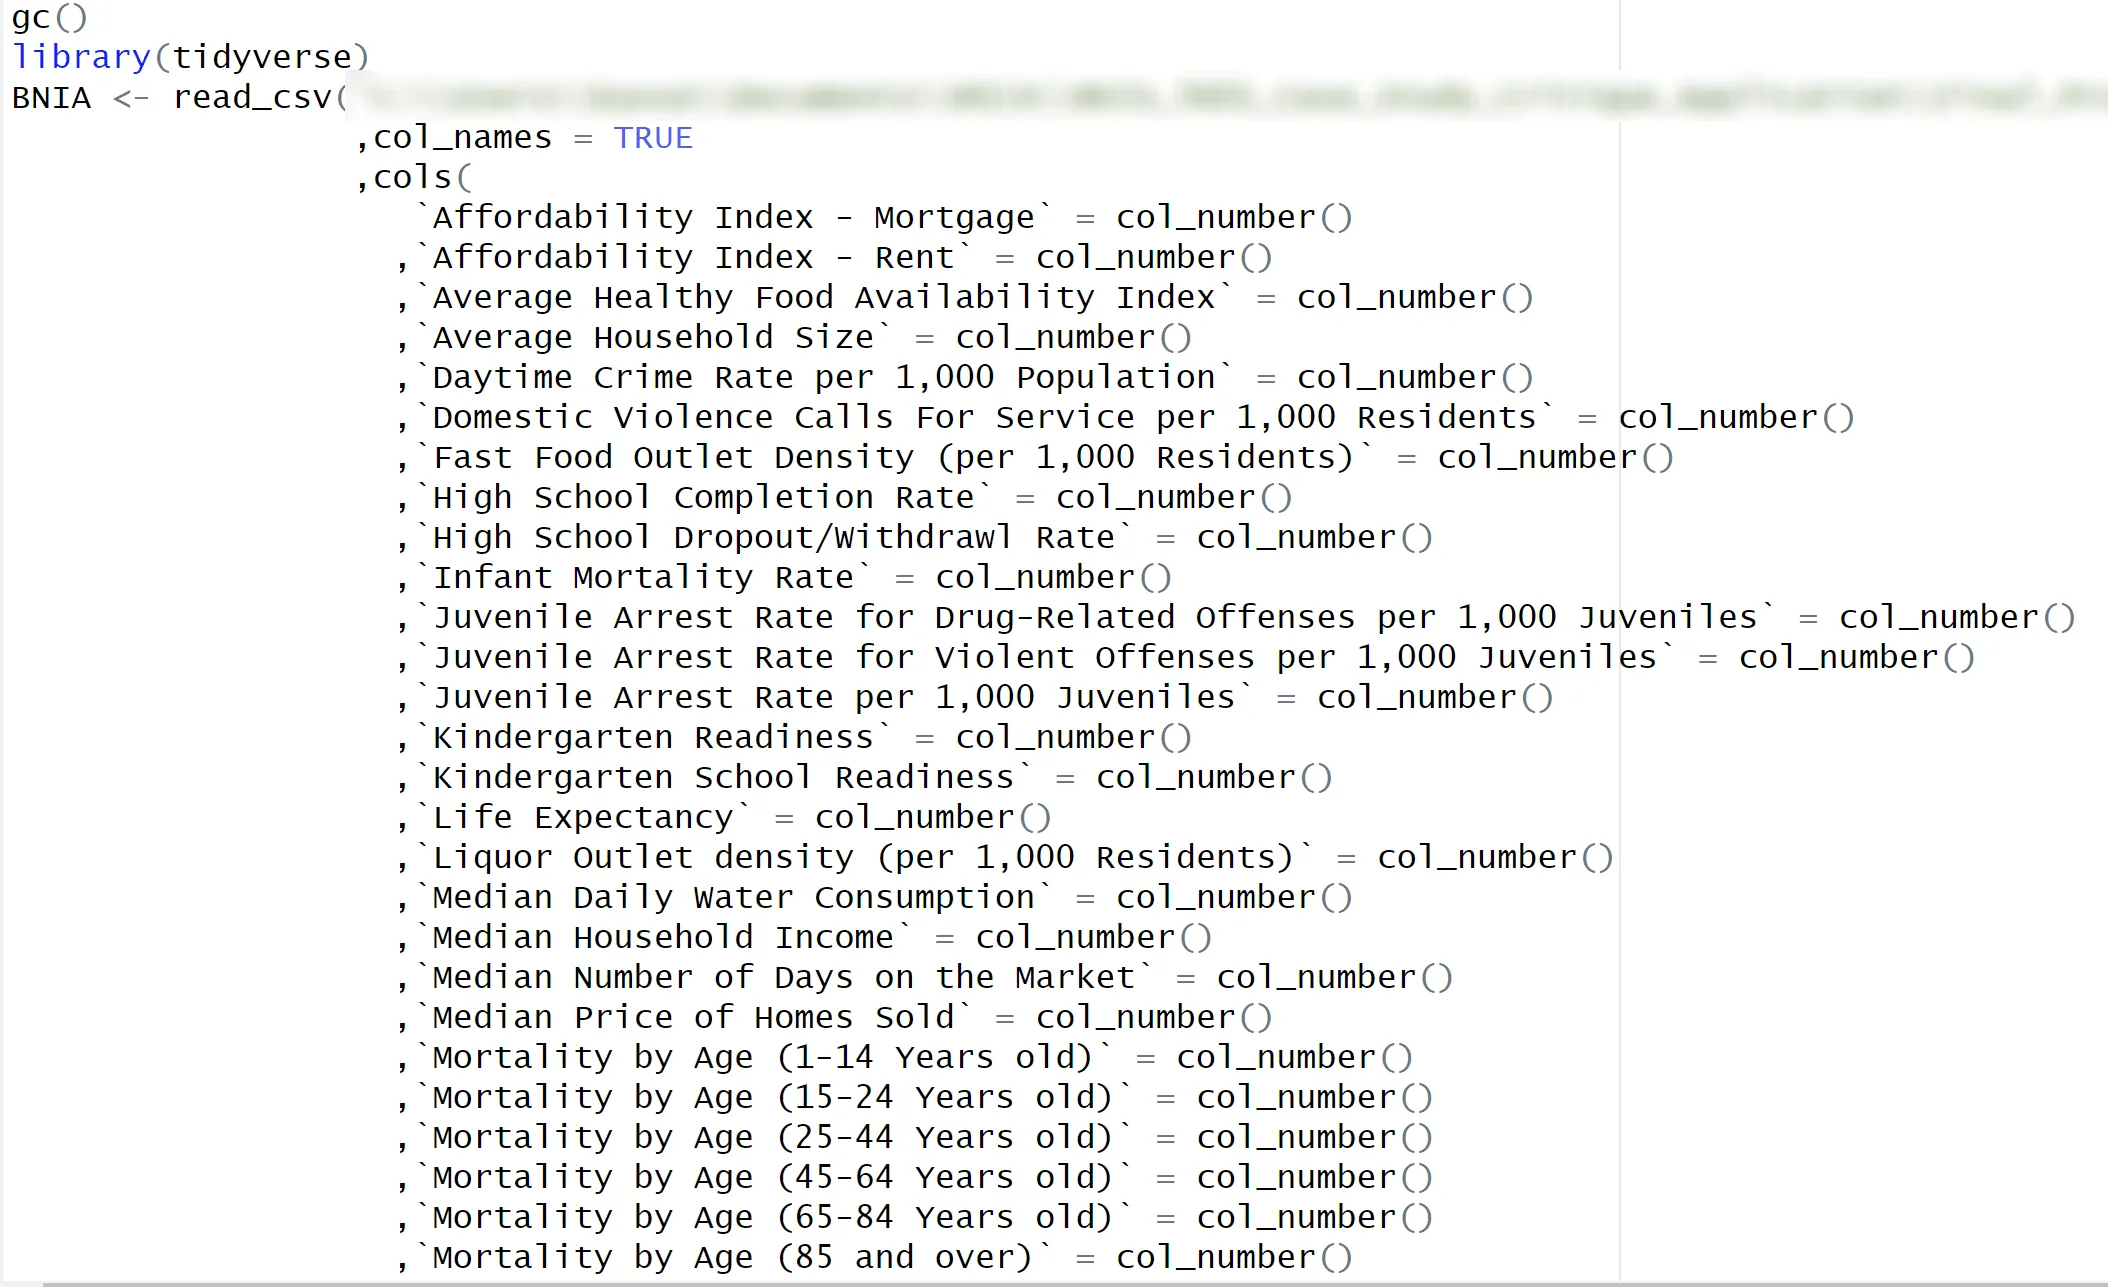
An R script that loads the tidyverse library and reads the BNIA data from a CSV file, listing dozens of neighborhood indicators as numeric columns, such as rent affordability, crime rates, school completion, life expectancy, and mortality by age.(opens full size)
R script loading the BNIA indicators to run correlations. The file path is blurred.
A spreadsheet of correlation results with columns Variable 1, Variable 2, and Correlation. The strongest pairs, from about 0.76 down to 0.58, link income, unemployment, labor-force participation, commute time, prenatal care, and birth weight.(opens full size)
The correlations were what I expected, but they didn't say much about how neighborhoods relate to each other.

After that first pass, it was back to the drawing board. I needed a different way to analyze Baltimore neighborhoods and start a conversation about their quality of life.

After some sketching, I settled on a scatterplot for the main visual, and an index emerged as a way to give each neighborhood a score. Six indicators from the correlation analysis stood out, and those are the ones I moved forward with.
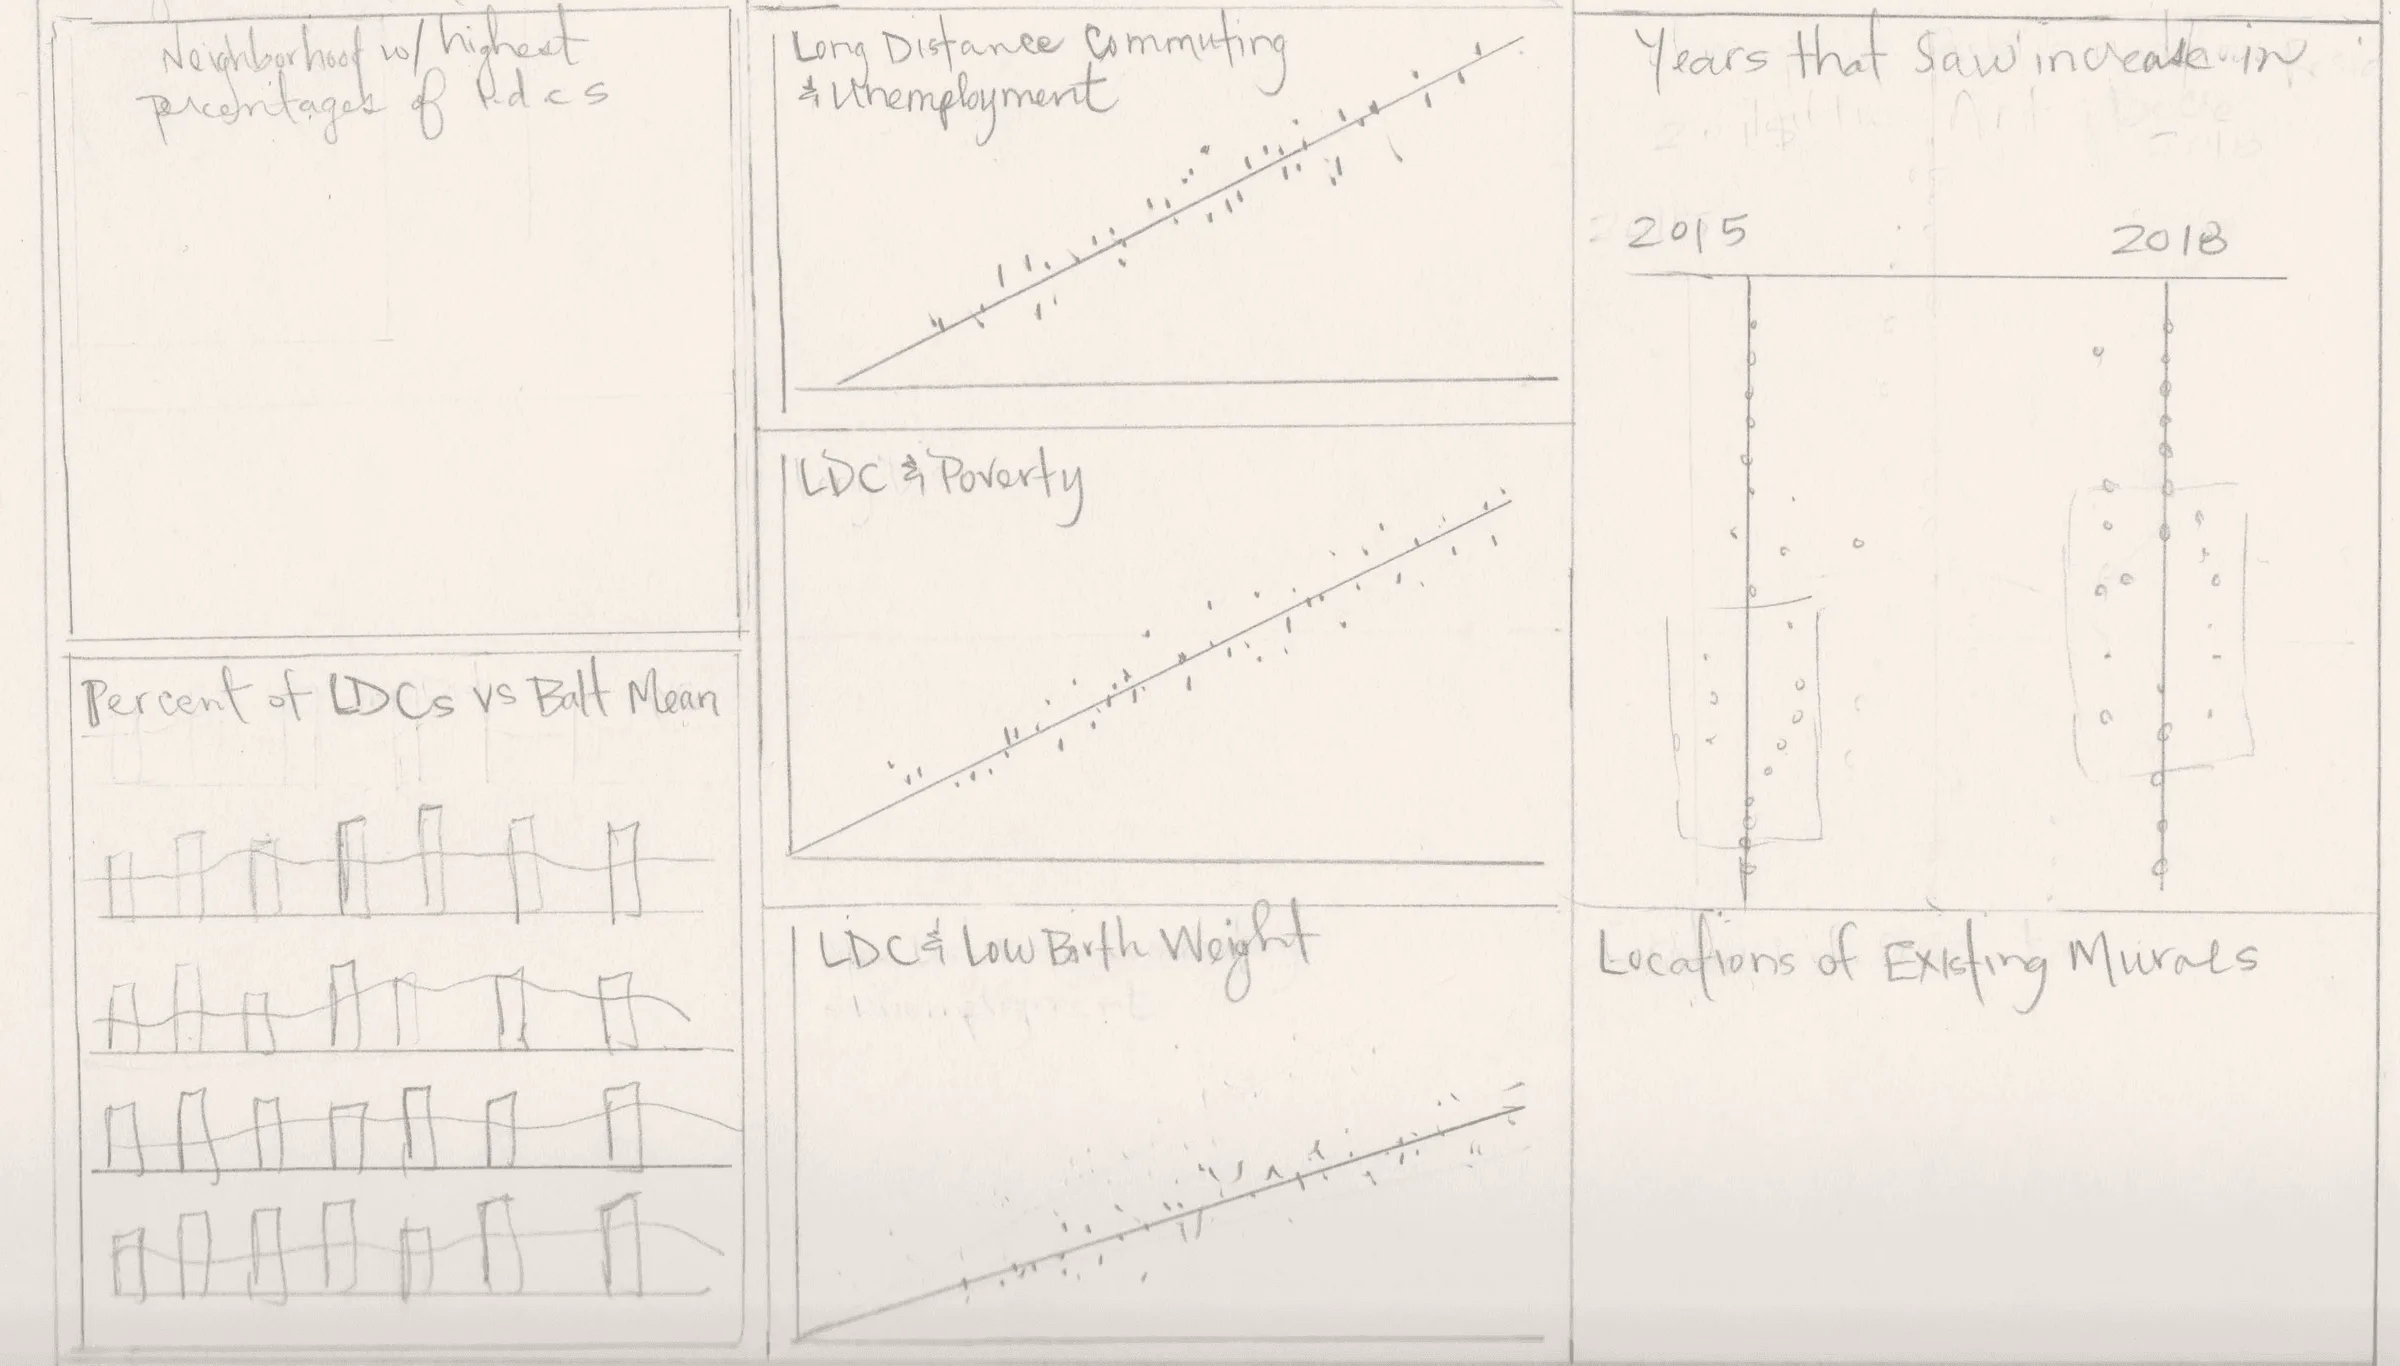
A pencil sketch of a poster layout with six panels: scatterplots of long-distance commuting against unemployment, poverty, and low birth weight; small bar charts comparing neighborhoods to the Baltimore mean; a dot chart comparing 2015 and 2018; and an empty panel for mural locations.(opens full size)
Sketching the layout and chart ideas.

I chose these six because a story about connectedness and disconnectedness started to emerge. I assigned three measures to each side and compared every neighborhood with the city mean. In the chart below, Canton has a high QOL score: its residents experience far less disconnectedness than the mean, with connectedness close to it. Southern Park Heights shows the opposite pattern.
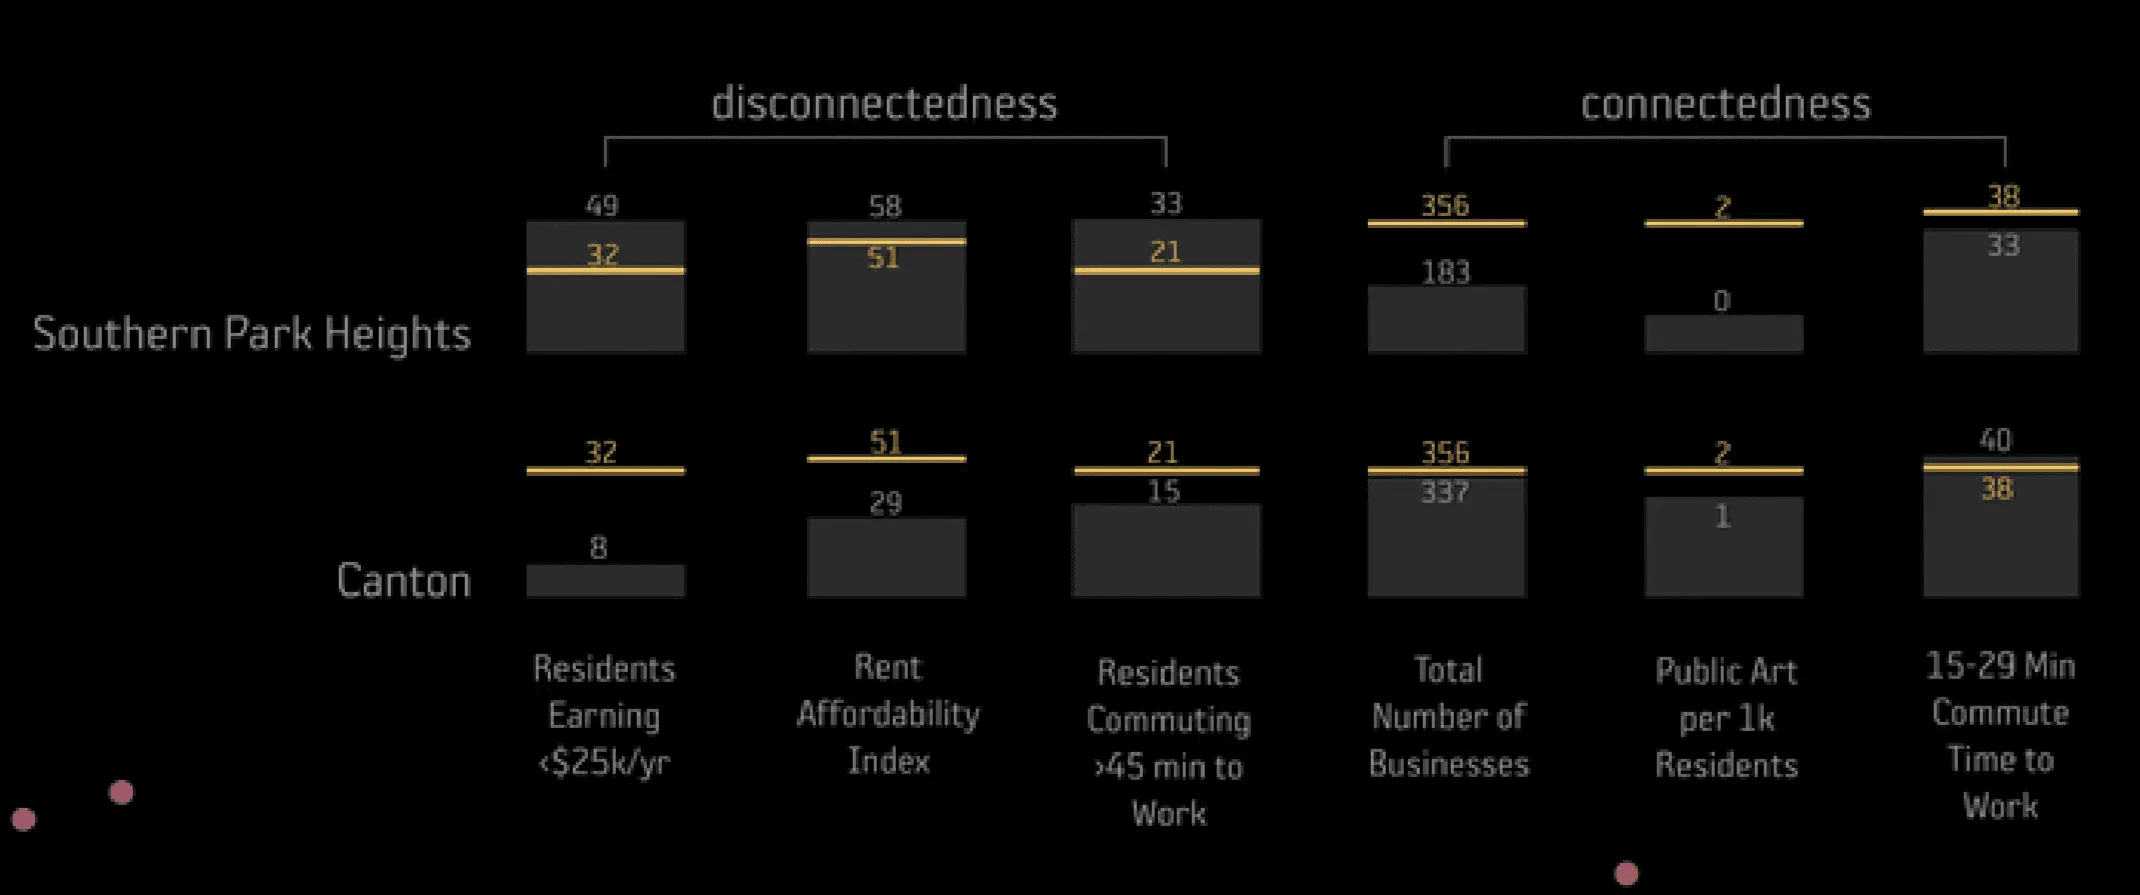
Small bar charts comparing Southern Park Heights and Canton with the city mean, shown as a gold line, on six measures. Disconnectedness: residents earning under $25,000 a year, rent affordability index, and residents commuting more than 45 minutes. Connectedness: total businesses, public art per 1,000 residents, and residents with a 15 to 29 minute commute. Southern Park Heights is above the mean on every disconnectedness measure and below it on every connectedness measure. Canton is well below the mean on disconnectedness.(opens full size)
Southern Park Heights and Canton against the city mean (the gold line) on all six measures.

I did the first pass in Tableau, assigning each neighborhood its calculated score. Then I exported the scatterplot into Illustrator for detailed design work on layout and color, and built the small bar charts in the top right there as well.
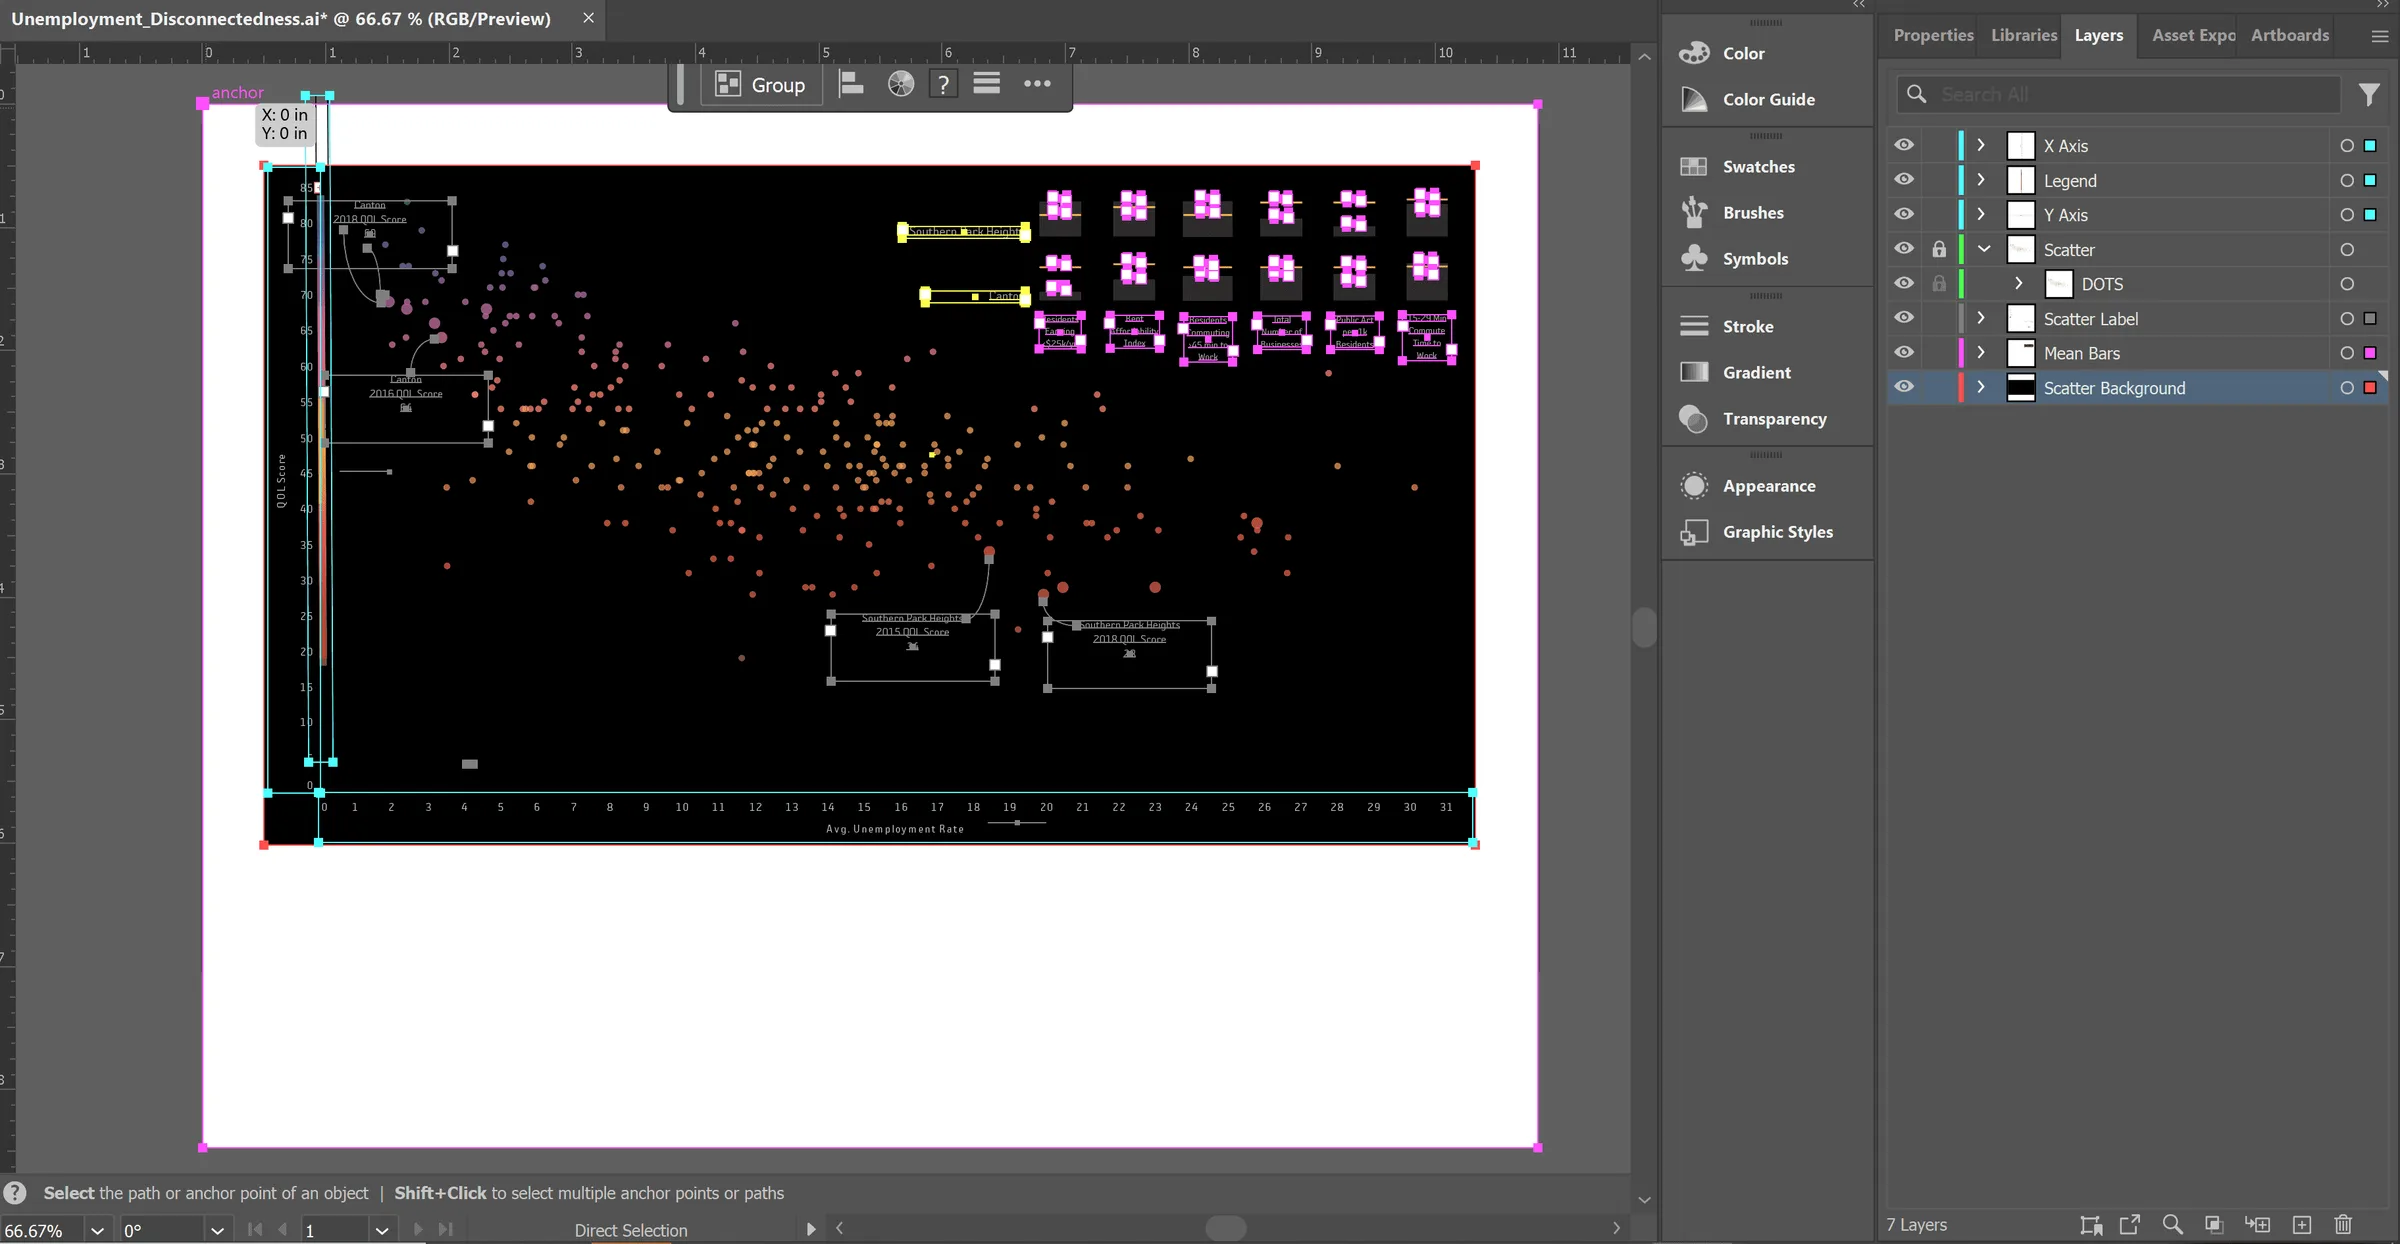
Adobe Illustrator with the scatterplot artboard open: orange and red dots on a black background, callout boxes for Canton and Southern Park Heights, the small bar charts at top right, and a Layers panel listing X Axis, Legend, Y Axis, Scatter, Scatter Label, Mean Bars, and Scatter Background.(opens full size)
The scatterplot in Illustrator for continued design work.

Final design

The finished poster plots every neighborhood’s QOL score against its average unemployment rate. Higher scores cluster where unemployment is low. Callouts follow Canton and Southern Park Heights across years: Canton scored 64 in 2016 and 60 in 2018, and Southern Park Heights scored 34 in 2015 and 28 in 2018.
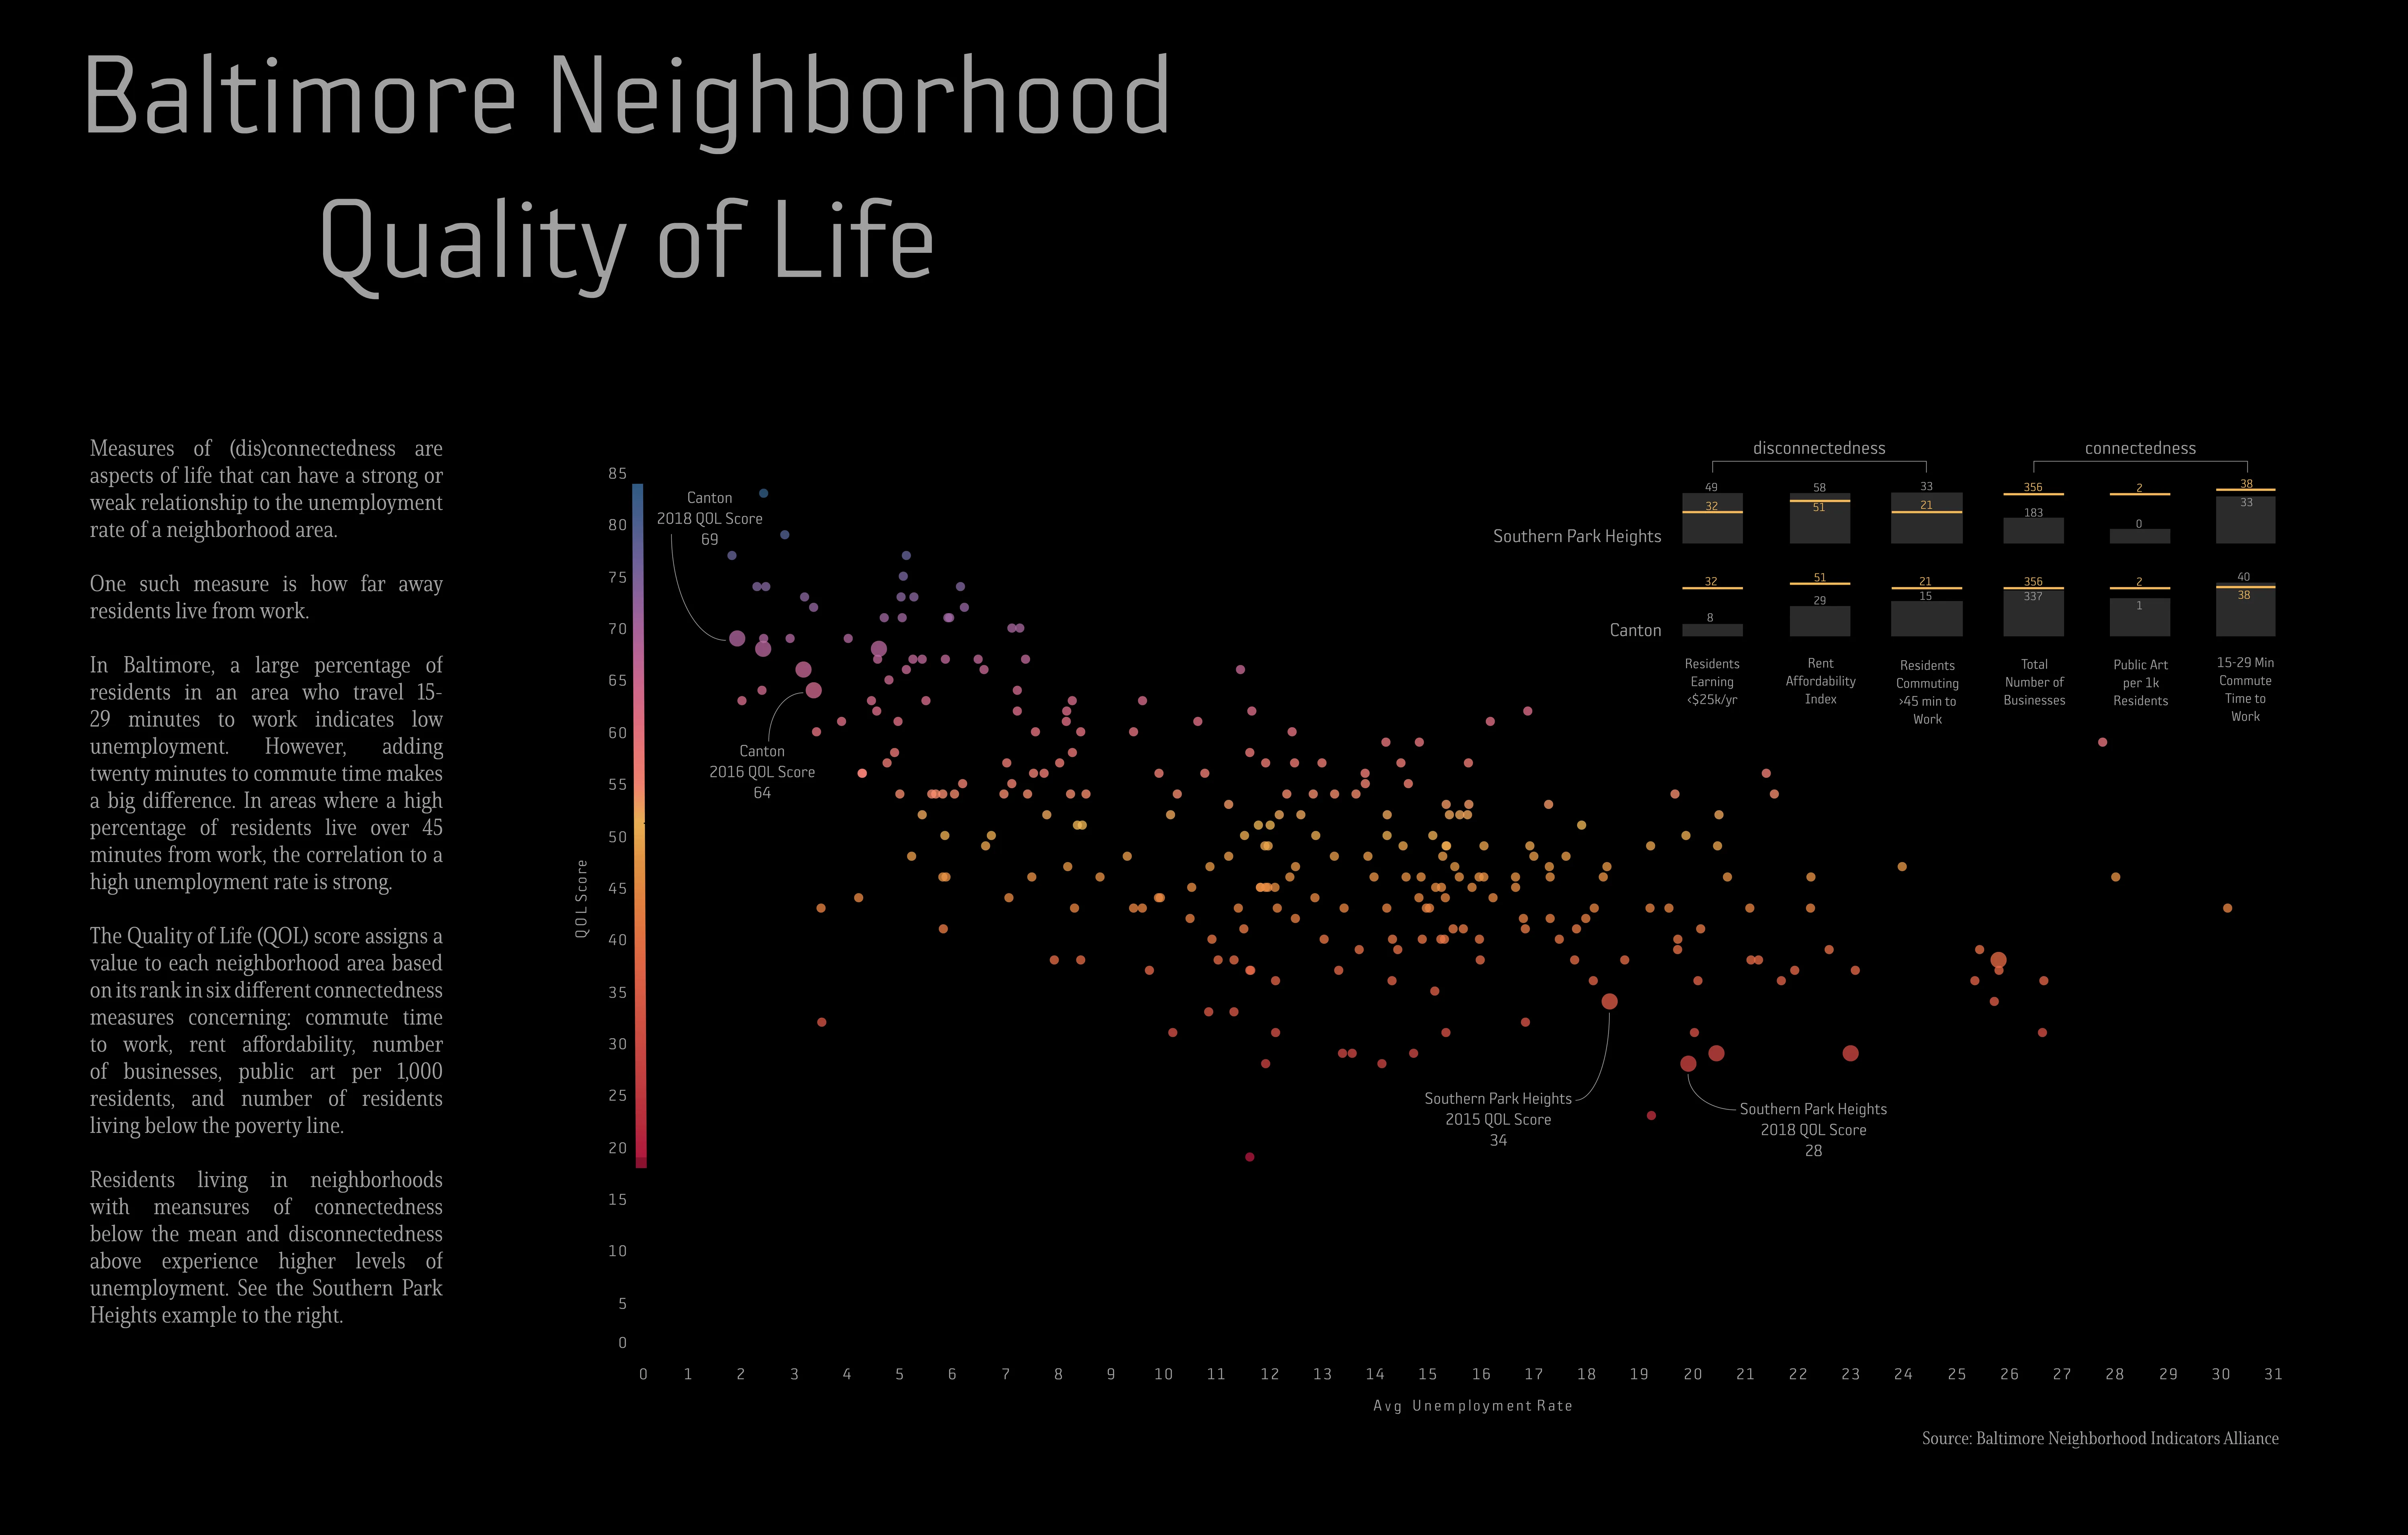
The full-resolution Baltimore Neighborhood Quality of Life poster: the QOL-versus-unemployment scatterplot, the six-measure comparison of Southern Park Heights and Canton, and the explanatory text, with BNIA cited as the source.
The final poster at full resolution. Scroll the preview to explore it. Open the full poster